Selling Vol Isn't Free Money: The 3 Numbers That Matter
Everyone knows vol mean-reverts. Almost nobody measures when it's actually rich. Research with formulas, real data and code: IV/HV Premium, IV Rank and Vol-of-Vol.
// Quant · QUANTARMY research
Selling Vol Isn't Free Money
IV/HV Premium, IV Rank and Vol-of-Vol
The Tuesday vol didn't revert
It's a Tuesday morning. You pull up the terminal, check the name you've been watching for weeks, and its 30-day implied vol is printing 48, sitting right at the top of its yearly range.
Vol is mean-reverting. Everyone knows that. So you do the obvious thing: you sell the straddle. Maybe, if you're prudent, an iron condor.
Two days later, implied prints 61. Your short is deep underwater, and the reversion you were promised is nowhere to be found. The position eventually comes back — mostly — after a week of not sleeping.
What went wrong? Actually, nothing. You were right that vol mean-reverts. But you were staring at the trees while ignoring the forest: a single implied vol number, on its own, tells you almost nothing about whether you should be selling it, buying it, or staying away.
To actually trade the reversion you need three things you can't read off that one print. Getting all three is what separates collecting premium from donating it. This piece is a full investigation of those three numbers — IV/HV Premium, IV Rank and Vol-of-Vol — with the formulas, the figures from the original Quant Galore × Alphanume Research study, an independent validation on real VIX data, and the code to reproduce everything.
Reversion is real, but it isn't free
Mean reversion in implied vol is one of the most reliable regularities in all of markets: vol spikes on fear, then bleeds back as the fear fades. It's so dependable that the entire short-vol complex — every iron condor seller, every FinTwit overwriter — is at root the same bet: today's elevated vol will be lower tomorrow.
Mathematically, the intuition anchors nicely in an Ornstein-Uhlenbeck process. If volatility followed one:
where is the long-run level, the speed of reversion and the volatility of volatility itself (keep that in mind — it will return). The half-life of a shock — how long until half of it dissipates — is:
And there's the first problem: the model that justifies your trade has two parameters you're not looking at. A high hands your vol back in days; a low leaves you swimming against the current for weeks. And a high turns the wait into a knife fight. "Vol mean-reverts" without and is a slogan, not a trade.
The second problem is reference. The instinct says: see high vol, sell it; see low vol, buy it; collect the difference. But high compared to what? A 48 vol for a sleepy regional utility is a five-alarm fire. For a small biotech walking into a data readout, it's cheap. The number means nothing until you anchor it to something, and "I have a feeling this is elevated" is not the anchor professionals use.
The right question splits into three:
- Is vol actually expensive? Are you being paid to sell it, relative to what the stock is really doing?
- Is it expensive for this specific name? Stretched far up in its own trailing range, or just normal-for-it?
- How stable is vol itself? Does the reversion come back as a gentle drift or a knife fight?
Three questions, three numbers. Let's take them one at a time.
Expensive compared to what? The volatility risk premium
The first meaning of "expensive vol" is expensive relative to realized. That's the classical volatility risk premium (VRP): the gap between what options are pricing (implied vol) and what the stock is actually delivering (realized vol).
Realized vol is estimated from price history. The simplest estimator is close-to-close:
and a statistically more efficient version is the Parkinson estimator, which uses each session's high-low range:
With both in hand, the VRP is expressed as a spread or, cleaner and comparable across names, as a ratio:
When 30-day implied sits above 30-day realized, and you're being paid more in premium than the stock has been moving. That's the crux of the IV/HV Premium feed: per name, per day, implied vs realized as both a spread and a ratio, ranked across the whole universe.
And why should that gap pay you at all? Because there's a direct theoretical link between the gap and expected P&L. For a delta-hedged short straddle, the accounting per unit of time is, to first order:
Note the detail almost nobody mentions: the expected edge is proportional to the difference of variances, not vols. It grows with the square of the gap: a ratio of 1.5 is not 50% more edge than 1.0 — it's units of variance versus . Almost six times as much. That's why the "richness" filter isn't cosmetic: it's the difference between trading with a tailwind and rowing upstream.
The data confirms it with uncomfortable clarity. Lining up forward reversion by IV/HV ratio bucket, selling vol where the ratio is below 1 bled — the cheap names kept drifting higher. The seller's edge only switches on above 1.0, and at the richest end, around 1.5×, the short captured roughly 7 vol points of reversion:
Expensive for this name? IV Rank
The second meaning is expensive relative to its own history. A 48 vol living in the 95th percentile of a name's trailing range is a very different animal from a 48 vol that's been the floor all year. The tool is IV Rank: today's implied (and realized) dropped into the name's own trailing 52-week band, as a 0-to-100 rank:
Don't confuse it with IV Percentile, which counts the fraction of days spent below the current level:
Rank tells you where you sit inside the range; percentile tells you how much time was spent below. After a single violent spike, rank can print 95 while percentile sits at 60. For hunting extreme stretches, rank is the more sensitive instrument.
And reversion, measured from the rank, is brutally clean. The study bucketed every stock in the universe by its IV rank and looked at what its 30-day implied did over the following month. The pattern is about as clean as anything you'll see in markets:
The higher the rank, the harder the reversion pulls. This is the signal under everyone's intuition, made measurable.
Stacking the edge: the full screen
Put the two legs together and the hunch becomes a robust screen. The flagship version is the conditioned premium sell, and it runs in five steps:
- Universe: the day's IV/HV Premium feed, settled rows only (
only_final=true), so you're not trading off a provisional intraday print. - Richness: filter to the top of the IV/HV ratio distribution (
min_ratio_rank=1.25or higher). This is the "am I actually being paid" gate. - Stretch: join in IV Rank and keep only names high in their own trailing band (
min_iv_rank=70). This is the "is reversion likely" arm. - Structure: the short as a strangle or iron condor around the at-the-money implied range, sized to the move the chain is implying — not to your conviction. A straddle's breakevens are ; the structure must respect them, not your enthusiasm.
- Harvest: let the reversion work over the following weeks, as rich, stretched vol does what rich, stretched vol does.
The difference between running this screen and just selling whatever looks high isn't theoretical. Measuring the vol points captured shorting 30-day vol and holding a month, sliced by how you screen:
This is the whole pitch, honestly. The general mechanism of selling high implied vol was never a secret or proprietary. What you couldn't do without the data is condition the trade tightly enough to be on the right side of it.
Vol-of-Vol: the third number
One question remains that the first two can't answer: once you're in, how violent is the ride?
That's Vol-of-Vol — the from the OU process we opened with. It measures the instability of a name's vol itself, e.g. as the standard deviation of daily implied-vol changes over the trailing window:
A low reading: vol is well-behaved and grinds around a level. A high reading: vol is whipping around, lurching between regimes. Same short (rich + high rank), split by vol-of-vol:
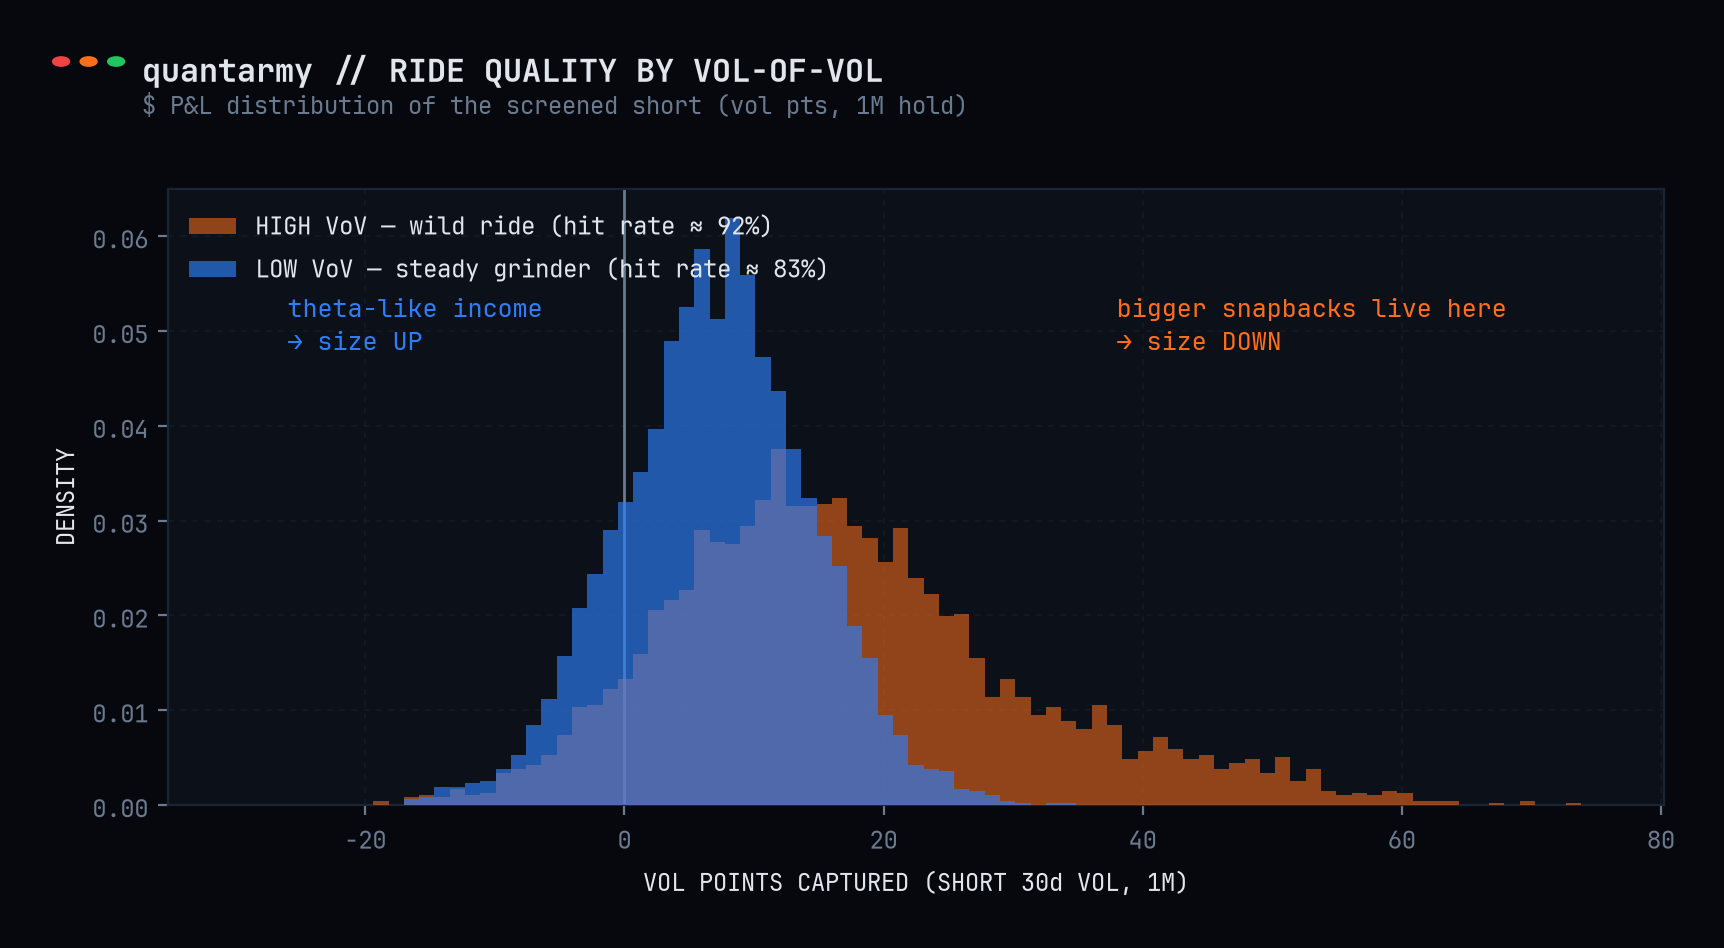
Vol-of-vol is, in practice, a sizing dial that tells you what kind of trade you're signing up for:
- Low VoV → steady, theta-like income. Smaller reversions, but you can size them up and sleep through them.
- High VoV → this is where the big snapbacks live, because the vol got violently stretched to begin with. They pay more and hit more often, but they'll also hand you a stomach-churning week or two before they resolve. Size those down.
There's more than shorting vol: the long side
When trading vol comes up, the conversation almost always skews to selling and collecting premium. But flip every sign and the same machinery points you at vol to buy.
When a name sits in the bottom decile of its IV rank, the same reversion math says its implied rises ~+32% over the following month. That's the classic long-gamma setup: vol cheap relative to its own history, with the pull upward more often than not.
The pluckier version pairs IV rank against HV rank: when implied is scraping the bottom of its range while realized is already starting to creep up above it, you're looking at a name whose options are priced for a calm the stock has quietly stopped delivering. Long the straddle — or whatever gives you the cleanest gamma — and let the implied catch up to the realized that's already moving:
Independent validation on real data
The study's numbers come from a proprietary feed (Alphanume). Does the pattern reproduce with public data? We checked with the CBOE's official VIX series — 2,711 observations between 2015 and 2026 — applying the exact same mechanics: 252-day rank of VIX, deciles, and forward 21-day change:
The structure is the same as in the single-stock universe: the more stretched the fear gauge is inside its own range, the harder reversion pulls. Different instrument, different data source, same law.
A note on method: what this is and what it isn't
These are real data pulls, not a turnkey backtest. The reversion being measured is a mark-to-market on the vol itself over a one-month forward window. The realized path and execution costs are live risks that sit on top of the vol move — and the vol-of-vol section is exactly about respecting the first of those.
In plain Greek: even if implied falls as the rank predicts, a short straddle can still lose money if the stock moves more than the vol drop compensates. The P&L equation doesn't lie:
and is a realization, not a promise. The point of this investigation is the proper filtering, and the demonstration that these three numbers move the odds in a measurable, stackable way. What you build on top of that is the fun part.
Conclusion: three questions, three numbers
Everyone already knows vol mean-reverts. That knowledge, on its own, is worth almost nothing — which is why so many people sell "high" vol and still manage to lose.
The edge is knowing, before you commit a dollar:
| Question | Number | Study threshold |
|---|---|---|
| Am I actually being paid? | IV/HV Premium — ratio | (edge dies below 1.0) |
| Is it stretched in its own range? | IV Rank (0–100, 52 weeks) | (D10 reverts ~-18%/month) |
| How rough is the ride? | Vol-of-Vol — | a sizing dial, not an entry signal |
If you've ever sold a straddle on a feeling and watched it gap against you, you already know exactly what these three numbers are worth.
This article expands the study "A Common Sense Guide to Volatility Trading" by Quant Galore × Alphanume Research (June 2026). The decile, ratio and filter figures are the ones they reported, redrawn in our style; the VIX validation is our own computation on official CBOE data. None of this is investment advice.
Code: full replication
The original study publishes its scripts in the Strategy Lab on GitHub (folder Stock Volatility Trading) using the Alphanume API. Here's our self-contained version, on 100% public data, which reproduces the VIX validation chart above and sets up the full toolbox (close-to-close HV, Parkinson, IV Rank, Vol-of-Vol) to apply to any name:
import numpy as np
import pandas as pd
import matplotlib.pyplot as plt

# ---------------------------------------------------------------
# TOOLBOX: realized vol, IV rank, vol-of-vol
# ---------------------------------------------------------------
def hv_close_to_close(px: pd.Series, window: int = 30) -> pd.Series:
    """Annualized close-to-close realized vol."""
    r = np.log(px / px.shift(1))
    return np.sqrt(252.0 / window * (r**2).rolling(window).sum())

def hv_parkinson(high: pd.Series, low: pd.Series, window: int = 30) -> pd.Series:
    """Annualized Parkinson (high-low range) realized vol."""
    hl = np.log(high / low) ** 2
    return np.sqrt(252.0 / window * (hl / (4 * np.log(2))).rolling(window).sum())

def iv_rank(iv: pd.Series, window: int = 252) -> pd.Series:
    """Position of today's vol inside its own trailing range, 0-100."""
    lo, hi = iv.rolling(window).min(), iv.rolling(window).max()
    return (iv - lo) / (hi - lo) * 100

def vol_of_vol(iv: pd.Series, window: int = 21) -> pd.Series:
    """Instability of vol itself: sd of daily IV changes."""
    return iv.diff().rolling(window).std()

# ---------------------------------------------------------------
# STUDY: VIX 252d-rank deciles -> forward 21d change (CBOE data)
# ---------------------------------------------------------------
URL = "https://cdn.cboe.com/api/global/us_indices/daily_prices/VIX_History.csv"
vix = pd.read_csv(URL, parse_dates=["DATE"])
vix = vix[vix["DATE"] >= "2015-01-01"].reset_index(drop=True)

c = vix["CLOSE"].astype(float)
rank = iv_rank(c, window=252)                 # VIX vs its own 52w range
fwd = c.shift(-21) / c - 1                    # forward 1M (~21 trading days)

df = pd.DataFrame({"rank": rank, "fwd": fwd}).dropna()
df["decile"] = pd.qcut(df["rank"], 10, labels=False) + 1

g = df.groupby("decile")["fwd"].mean() * 100
print(g.round(2))
print("top decile, share negative :",
      round((df[df.decile == 10]["fwd"] < 0).mean() * 100, 1), "%")
print("bottom decile, share positive :",
      round((df[df.decile == 1]["fwd"] > 0).mean() * 100, 1), "%")

g.plot(kind="bar", color=["#2d7ff9" if v > 0 else "#ff6e1a" for v in g])
plt.ylabel("mean fwd 21d dVIX (%)"); plt.xlabel("VIX rank decile")
plt.axhline(0, color="grey", lw=1); plt.show()
Expected output (the numbers from the validation chart):
decile
1     11.67
2     12.84
3     10.51
4      9.87
5      8.65
6      4.88
7      0.39
8      0.04
9     -5.74
10   -13.69
top decile, share negative : 77.9 %
bottom decile, share positive : 72.8 %
To take it to individual stocks you only need a source of 30-day implied vol per name (your broker's, ORATS, or the Alphanume API with a free key) crossed with daily OHLC: hv_close_to_close gives you realized, iv_rank the stretch, vol_of_vol the temperament. The full screen is literally three lines of pandas over those columns — the rest is discipline.
Want to go deeper on rigorously measuring and budgeting tail risk inside a systematic flow? The open course QAO — Quantitative risk: VaR and Expected Shortfall covers the full framework with real code.
None of this is investment advice.